Survey
Xtrack provides a survey method associated with the line that can be used to
compute the position and orientation of the local reference frame in a global
coordinate system. The returned table contains, among other quantities, the
global coordinates X, Y and Z and the orientation angles theta,
phi and psi at each element.
For a complete description of the available options, please refer to the Survey API reference.
Basic usage
The following example builds a small line, computes its survey, inspects a few
columns from the resulting table, and makes a floor plot using
survey.plot.
import numpy as np
import xtrack as xt

# Build a simple line with four bending magnets and three quadrupoles.
env = xt.Environment(particle_ref=xt.Particles(p0c=1e9))

line = env.new_line(length=12, components=[
    env.new('b1', xt.Bend, length=0.5, angle=np.deg2rad(22.5),
            k0_from_h=False, at=1.5),
    env.new('qf1', xt.Quadrupole, length=0.3, k1=0.4, at=2.8),
    env.new('b2', xt.Bend, length=0.5, angle=-np.deg2rad(22.5),
            k0_from_h=False, at=4.0),
    env.new('qd1', xt.Quadrupole, length=0.3, k1=-0.4, at=5.5),
    env.new('b3', xt.Bend, length=0.5, angle=-np.deg2rad(22.5),
            k0_from_h=False, at=8.0),
    env.new('qf2', xt.Quadrupole, length=0.3, k1=0.4, at=9.2),
    env.new('b4', xt.Bend, length=0.5, angle=np.deg2rad(22.5),
            k0_from_h=False, at=10.5),
])

# Compute the survey.
survey = line.survey()

# Inspect selected columns of the survey table.
survey.cols['name s X Y Z theta phi psi']

# Make a floor plot of the reference trajectory in the Z-X plane.
import matplotlib.pyplot as plt
plt.close('all')

survey.plot(
    projection='ZX',
    labels=['b1', 'b2', 'b3', 'b4'],
    element_width=0.12,
    figsize=(6.4, 4.8),
)

fig1 = plt.gcf()
plt.title('Survey floor plot')
fig1.subplots_adjust(left=.13, right=.95, bottom=.13, top=.90)
plt.show()

# Complete source: xtrack/examples/survey/000_survey.py
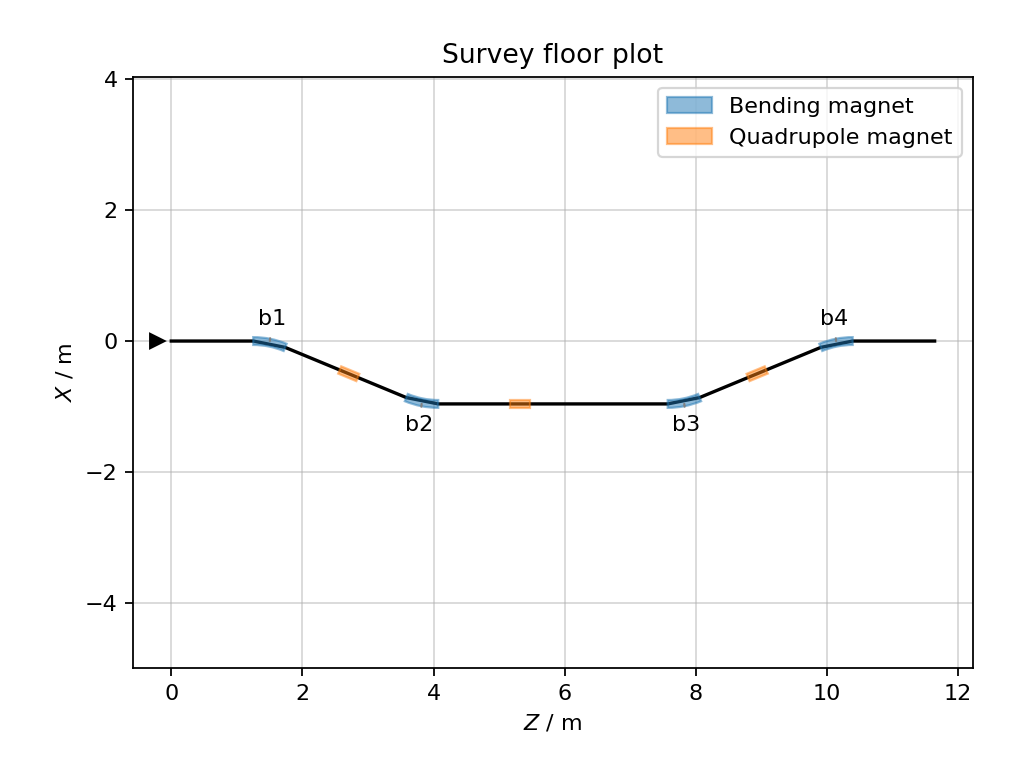
Floor plot of the reference trajectory as obtained from Xtrack survey.
Reference and element frames
By default, a survey describes the reference trajectory. With
include_element_frames=True, the survey table also contains the frames at
the actual entrance and exit of each element, including the effect of element
misalignments. The four frames associated with an element can be retrieved as
xtrack.Frame objects using
xtrack.survey.SurveyTable.get_all_frames().
The following example places a translated and rotated quadrupole on a straight reference trajectory, extracts its reference and element frames, and compares their positions.
import numpy as np
import xtrack as xt

# Build a line containing a misaligned quadrupole.
env = xt.Environment()

line = env.new_line(length=10, components=[
    env.new('q', xt.Quadrupole, length=4, at=5),
])

env['q'].rot_shift_anchor = 1.0  # Misalignment pivot, from the element start
env['q'].rot_y_rad = np.deg2rad(30)
env['q'].shift_x = 0.1

# Include the reference and actual element frames in the survey table.
survey = line.survey(include_element_frames=True)

# Inspect the element entrance and exit coordinates.
survey.cols[
    'name s '
    'X_elem_start Y_elem_start Z_elem_start '
    'X_elem_end Y_elem_end Z_elem_end'
]

# Extract all four frames associated with the quadrupole.
frames_at_q = survey.get_all_frames('q')
q_start = frames_at_q['elem_start']
q_end = frames_at_q['elem_end']
q_ref_start = frames_at_q['ref_start']
q_ref_end = frames_at_q['ref_end']

# Frames expose their position, local unit vectors, and survey angles.
q_start.XYZ
q_start.es
q_start.theta

# Frames can also be expressed in the CERN Coordinate System (CCS).
q_start_ccs = q_start.to_ccs()

# Plot the reference trajectory and the actual quadrupole position.
import matplotlib.pyplot as plt
plt.close('all')

fig1, ax = plt.subplots(figsize=(6.4, 4.8))
ax.plot(survey.Z, survey.X, '.-', label='Reference trajectory')
ax.plot(
    [q_ref_start.Z, q_ref_end.Z],
    [q_ref_start.X, q_ref_end.X],
    linewidth=5,
    alpha=0.35,
    label='Quadrupole reference placement',
)
ax.plot(
    [q_start.Z, q_end.Z],
    [q_start.X, q_end.X],
    '.-',
    linewidth=2,
    label='Actual quadrupole position',
)
ax.set_xlabel('Z [m]')
ax.set_ylabel('X [m]')
ax.set_title('Reference and element frames')
ax.axis('equal')
ax.grid(True, alpha=0.3)
ax.legend()
fig1.subplots_adjust(left=0.13, right=0.97, bottom=0.13, top=0.90)
plt.show()

# Complete source: xtrack/examples/survey/001_survey_element_frames.py

Reference placement and actual position of a misaligned quadrupole.
Starting from a selected element
By default, line.survey() starts from the beginning of the line with the
global frame aligned to the local reference frame. A different origin and
orientation can be selected with element0 and the initial coordinates
X0, Y0, Z0, theta0, phi0 and psi0.